


Anomaly detection using set representations and density estimations
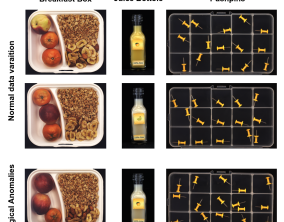
Anomaly detection aims to automatically identify samples that exhibit unexpected behavior. We tackle the challenging task of detecting anomalies consisting of an unusual combination of normal elements (`logical anomalies`). For example, consider the case where normal images contain two screws and two nuts but anomalous images may contain one screw and three nuts. We propose to detect logical anomalies using set representations. We score anomalies using density estimation on the set of representations of local elements. Our simple-to-implement approach outperforms the state-of-the-art in image-level logical anomaly detection and sequence-level time series anomaly detection.(nuts or screws) occur in natural images, previous anomaly detection methods relying on anomalous patches would not succeed. Instead, a more holistic understanding of the image is required. You can check out the preprint at: https://arxiv.org/pdf/2302.12245.pdf
Goal
Set Features for Fine-grained Anomaly Detection
Researchers
What we did
Fine-grained anomaly detection has recently been dominated by segmentationbased approaches. These approaches first classify each element of the sample (e.g., image patch) as normal or anomalous and then classify the entire sample as anomalous if it contains anomalous elements. However, such approaches do not extend to scenarios where the anomalies are expressed by an unusual combination of normal elements. We overcome this limitation by proposing set features that model each sample by the distribution of its elements. We compute the anomaly score of each sample using a simple density estimation method. Our simple-to-implement approach1 outperforms the state-of-the-art in image level logical anomaly detection (+3.4%) and sequence-level time series anomaly detection (+2.4%).
Results
Preprint: https://arxiv.org/pdf/2302.12245.pdf
Infer, filter and enhance topological signals in single-cell data using spectral template matching
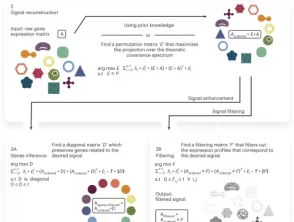
Single-cell RNA sequencing is a powerful technology that allows researchers to analyze gene expression in individual cells, providing insights into cellular processes and functions. However, analyzing this data can be challenging, as cells can simultaneously encode multiple, potentially cross-interfering, biological signals. A new computational method, scPrisma, was developed to address this challenge. scPrisma has the ability to uncover cellular spatiotemporal context and has the potential to drive further insights into cellular processes and functions, ultimately advancing our understanding of biology. You can check out the published article at: https://www.nature.com/articles/s41587-023-01663-5
Goal
Infer, filter and enhance topological signals in single-cell data using spectral template matching
Researchers
- Jonathan Karin
- Yonathan Bornfeld
- Mor Nitzan
What we did
We apply scPrisma to the analysis of the cell cycle in HeLa cells, circadian rhythm and spatial zonation in liver lobules, diurnal cycle in Chlamydomonas and circadian rhythm in the suprachiasmatic nucleus in the brain. scPrisma can be used to distinguish mixed cellular populations by specific characteristics such as cell type and uncover regulatory networks and cell–cell interactions specific to predefined biological signals, such as the circadian rhythm. We show scPrisma’s flexibility in incorporating prior knowledge, inference of topologically informative genes and generalization to additional diverse templates and systems. scPrisma can be used as a stand-alone workflow for signal analysis and as a prior step for downstream single-cell analysis.
Results
https://www.nature.com/articles/s41587-023-01663-5
What do AI Models Know? A Case Study on Visual Question Answering
A major challenge in recent AI literature is understanding why state-of-the-art deep learning models show great success on a range of datasets while they severely degrade in performance when presented with examples which slightly vary from their training distribution. In this proposal, we will examine this question in the context of visual question-answering, a challenging task which requires models to jointly reason over images and text. We will start our exploration with the GQA dataset, which, along with images and text, also includes a rich semantic scene graph, representing the spatial relations between objects in the image, and thus lends itself to probing through high-quality automatic manipulation. In prelminary work we have augmented GQA with examples that vary slightly from the original questions, and shown that here too high-performing models perform much worse on the augmented questions compared to the original ones. Our proposal will analyze our results, exploring the reasons for the drop in performance, and what makes our new questions more challenging. We also plan to to generalize the reasons we find to other datasets of visual question answering, and more broadly to other AI datasets. Given those insights, we will augment the training set with instances that capture model “blind spots”, in an attempt to improve the model’s generalization ability. Our results will improve our understanding of what state-of-the-art AI models know, what they are still missing, and how can we improve them based on this new understanding.
Goal
To achieve a better understanding of the limitations of current state-of-the-art models and datasets, as well as ways to improve them.
Researchers
What we did
In progress
Results
Forthcoming
Formally Verifying Deep Learning Policies for Computer Systems
Deep machine learning is revolutionizing computer science. Instead of manually creating complex software, engineers now use automatically-generated deep neural networks (DNNs). DNNs are being used in critical financial, medical and autonomous driving systems, obtaining previously unimaginable results. Recently, they are being adopted also in the field of computer systems, replacing hand-crafted algorithms that control key infrastructure, such as adaptive bit rate selection and congestion control algorithms. But despite their remarkable achievements, DNN opacity is a tremendous challenge: DNNs work, but we do not fully understand how or why, and cannot manually prove their correctness. Consequently, there is a crucial need to ensure that DNNs operate correctly. This issue is urgent, as errors have already been observed in modern DNNs: for example, slight perturbations to inputs (“adversarial examples”) that can cause modern DNNs to perform severe misclassification errors. This lack of formal guarantees about DNN behavior is preventing their safe deployment in critical systems.
Recent and exciting developments in the field of formal methods allow us to automatically reason about DNNs. However, this is a nascent technology, and we are just now beginning to tap its full potential. Here, we propose to bring together Prof. Schapira’s expertise in computer networks and Dr. Katz’s expertise in neural network verification, in order to create techniques and tools suitable for the formal verification of learning-based computer networks policies. We will develop novel certification techniques, capable of leveraging common traits of computer network algorithms in order to achieve better flexibility and scalability than general, off-the-shelf verification tools. We will then apply these techniques to state-of-the-art controllers in computer networks. Our research will thus help ensure the safety and correctness of key computer network systems before they are deployed, greatly benefiting programmers, engineers, and users of these systems.
Goal
To combine the recent advances in learning-based controllers for computer systems with those in DNN verification, in order to ensure the robustness and reliability of these controllers.
Researchers
What we did
In progress
Results
Forthcoming